Logging, Metrics, and Tracing with Node.js
Thomas Hunter II
Adapted from Distributed Systems with Node.js:
bit.ly/34SHToF
Logging
The console.log() of the cloud
What is Logging?
- A way to extract granular state from a program
- Often well-structured JSON data instead of free text
- Logs often have associated severity levels
- error, warn, info, http, verbose, debug, silly
- Severity allows filtering, e.g. ignore
debugin prod - Logs can written to stdout, file system, network
winstonis a popular npm package for logging
Winston Example
import winston from 'winston';
export default winston.createLogger({
  level: 'info',
  format: winston.format.json(),
  defaultMeta: { env: process.env.NODE_ENV,
                 app: 'profile-service' },
  transports: [
    new winston.transports.File({
      filename: '/var/log/nodeapp.log'
    }),
    new winston.transports.Console()
  ]
});
Common Logging Conventions
- Global logger, and request-specific logger
- A Request UUID can associate related logs
import Logger from '../logger.mjs';

server.addHook('onRequest', async (req) => {
  const request_id = crypto.randomUUID();
  req.logger = Logger.child({ request_id });

  const { url, method } = req.context.config;
  req.logger.info('on_request', { url, method });
});
Example contextual log
- Help the code archaeologist diagnose a bug
try {
  await database.save(record);
} catch (err) {
  req.logger.error('db_persist_error', {
    error: err.message,
    stack: err.stack,
    id: record.id
  });
  return reply.code(500).send('unable to save');
}
Logging Solutions
What do logs look like?
message:"handled request" AND status_code>=500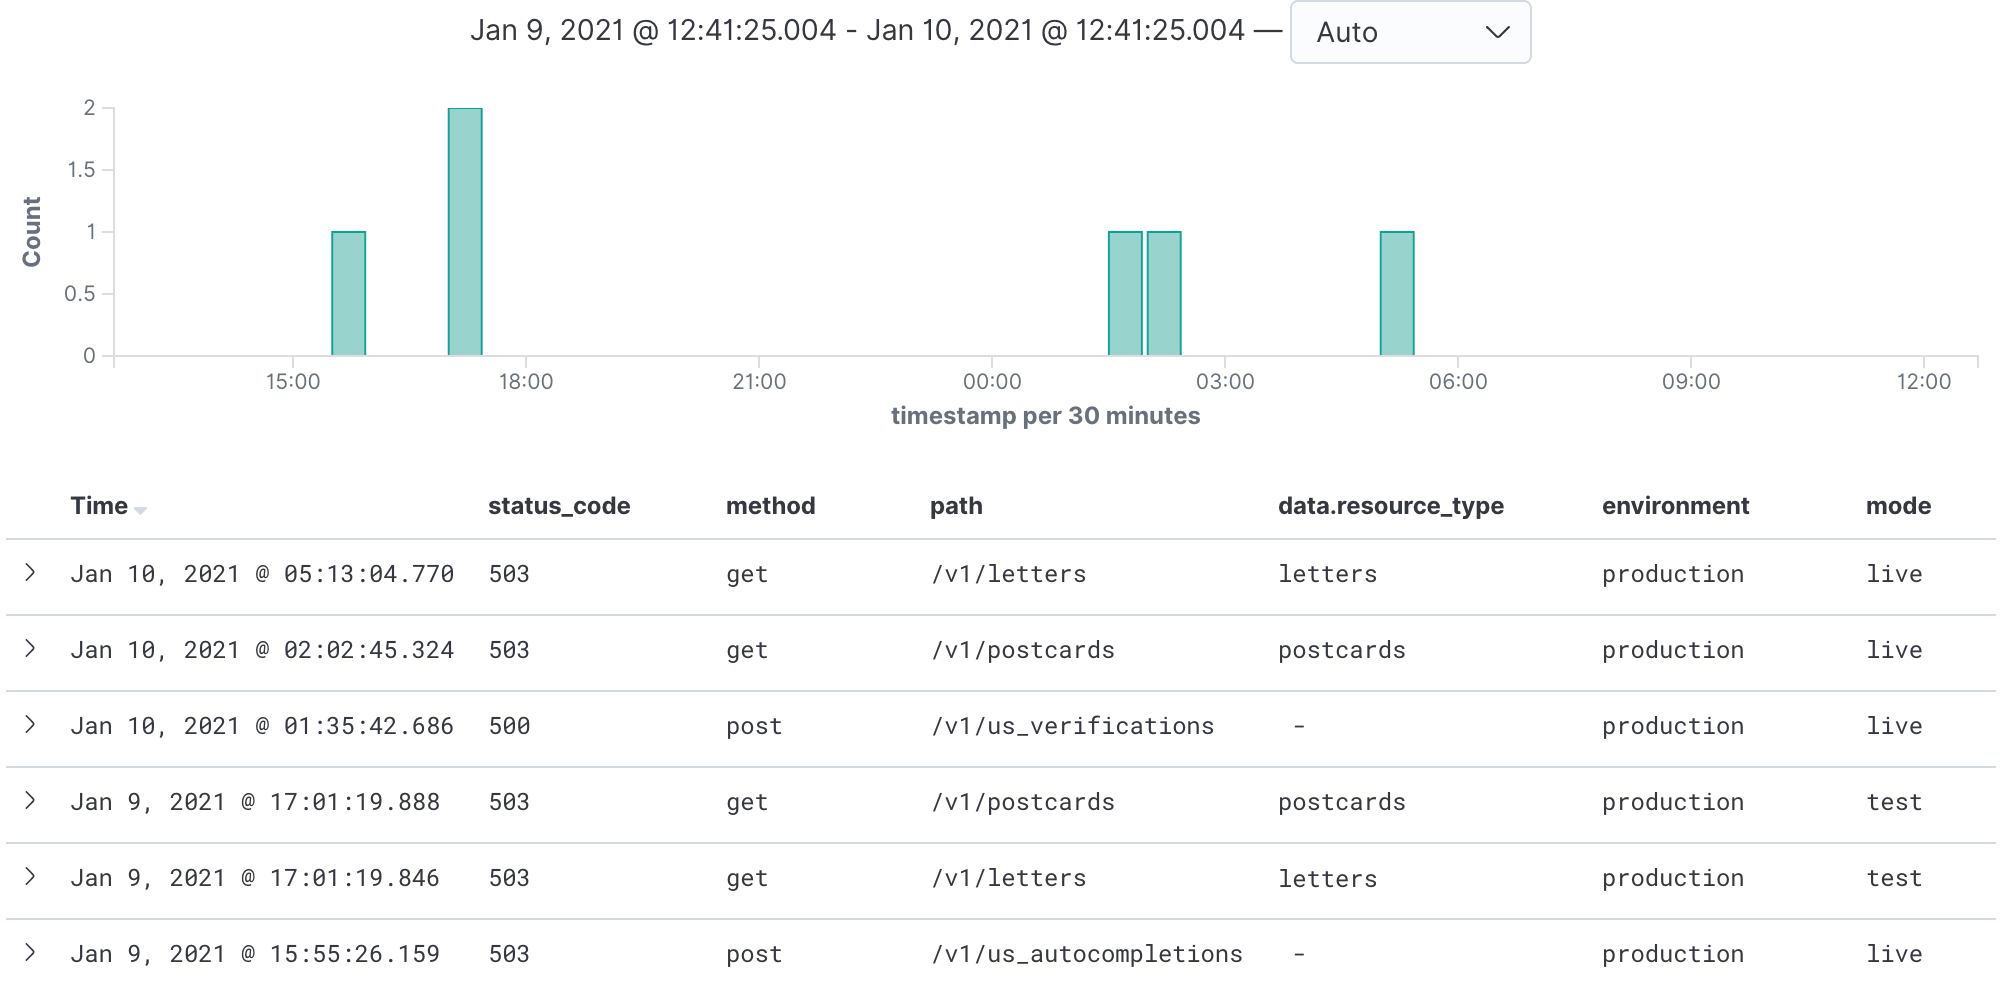
Metrics
Aggregate, numeric data
What are Metrics?
- Numeric, time-series data, to understand app health
- Metrics usually have a name and sometimes tags
- Real world info that benchmarks can't tell you
- Request throughput, request timing, memory usage
- Response status codes, endpoint popularity
- Money spent, user churn, ad clicks
- Metrics are usually cheaper than logs
Example Code
import StatsD from 'statsd-client';
const statsd = new StatsD({ prefix: 'myapp.' });

server.addHook('onResponse', async (req, reply) => {
  statsd.timing('request.time',
    reply.getResponseTime());
  statsd.increment('request.status.' +
    reply.raw.statusCode);
  statsd.increment('request.method.' +
    req.context.config.method);
});
Metrics Solutions
What do Metrics look like?
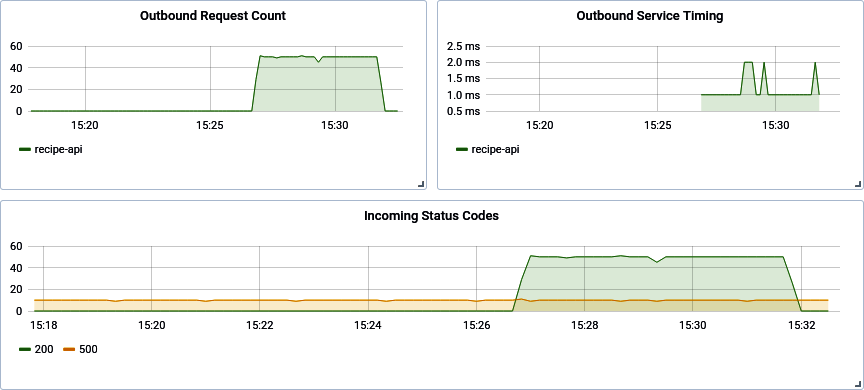
aliasByNode(myapp.request.status.*, 4)Distributed Tracing
Inter-Service Communication
What is Distributed Tracing?
- Associates related requests across services
- Generate and pass around a Request UUID
- Span IDs are generated for req/res pairs
- These IDs are passed around as HTTP headers
- Info is sent to a central management service
- Allows request hierarchy to be visualized
- Which service was slow/failed for given request
- Bonus: Attach Request UUID to request logger
Example Tracing Implementation
import Zipkin from 'zipkin-lite';
import fastify from 'fastify';
import fetch from 'node-fetch';

const zipkin = new Zipkin({
  zipkinHost: 'localhost:9411',
  serviceName: 'shallow-api',
  servicePort: 80,
  serviceIp: '1.2.3.4',
});
const server = fastify();

server.addHook('onRequest', zipkin.onRequest());
server.addHook('onResponse', zipkin.onResponse());
Example Tracing Implementation
server.get('/widgets/:id', async (req, reply) => {
  console.log('REQUEST ID:', req.zipkin.trace);
  req.zipkin.setName('get_widget');

  // ...
  const zreq = req.zipkin.prepare();
  const url = 'http://example.org/foo/42';
  const result = await fetch(url, {
    headers: zreq.headers });
  zreq.complete('GET', url);
  // ...

  return result.text();
});
Tracing Solutions
What does Tracing look like?
Zipkin looks like a hierarchy
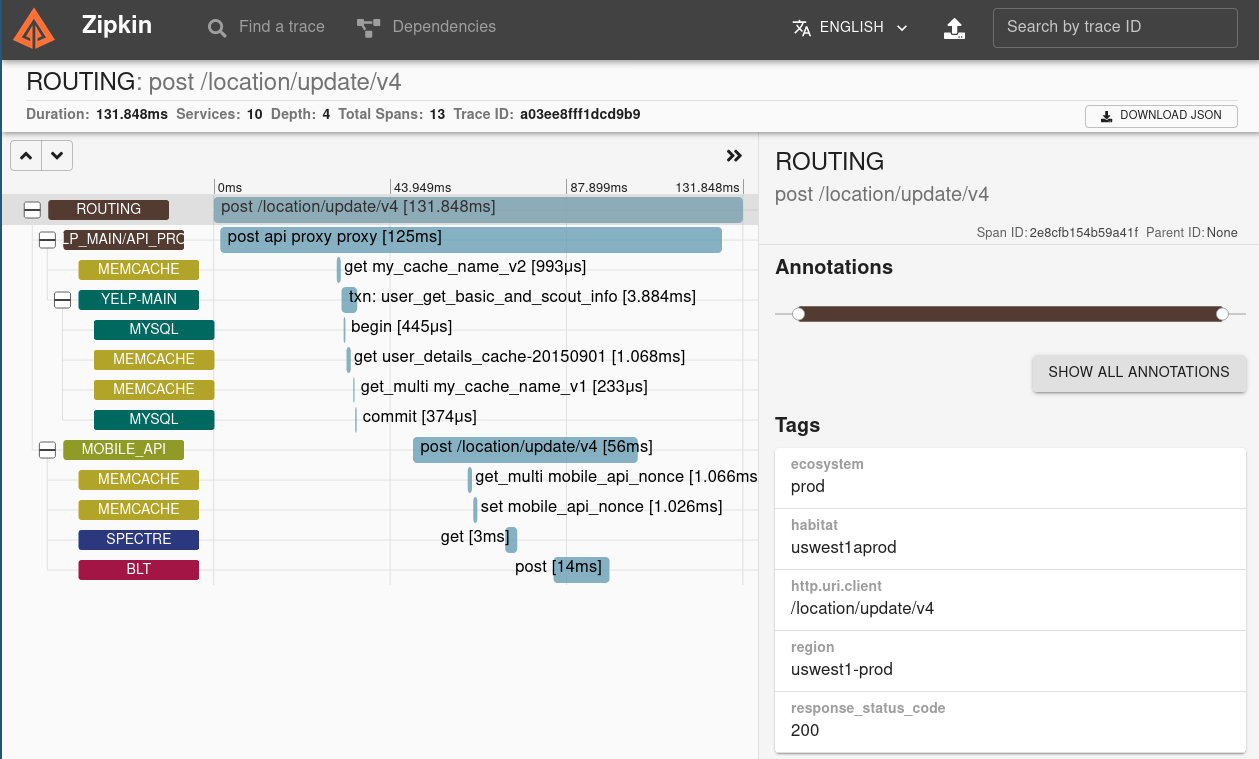
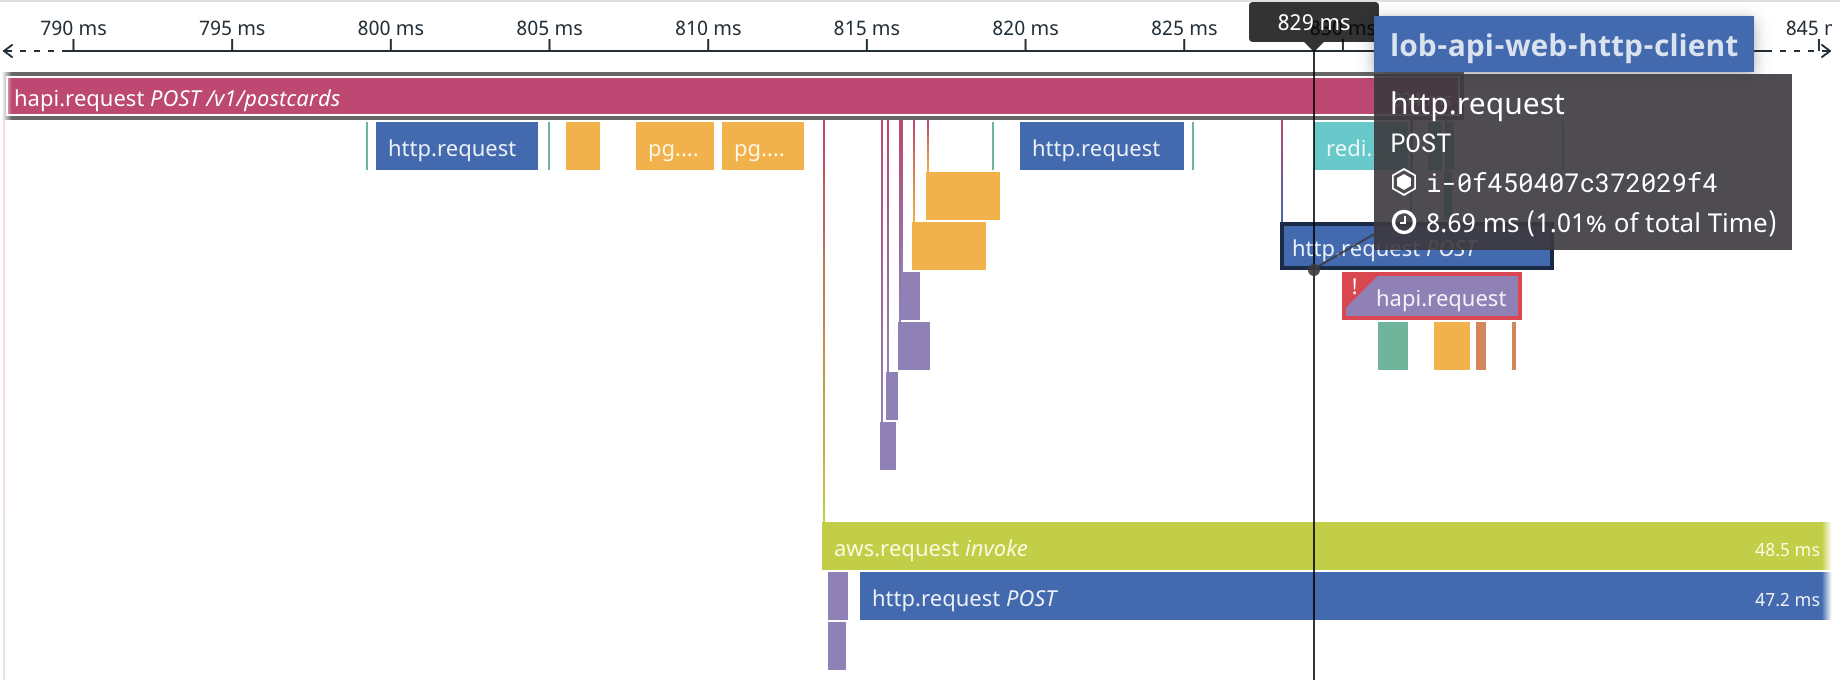
What does Tracing look like?
Datadog APM looks like a perf timeline
Logging, Metrics, and Tracing with Node.js
- Follow me: @tlhunter@mastodon.social
- This presentation: bit.ly/2MymKJD
- Distributed Systems with Node.js: bit.ly/34SHToF